Explore data, graphs and reports
Abstract
The objective of this database system is to provide an up-to-date, neutral, comprehensive source of forest products bilateral trade statistics to the public through an online interface. The system modernises the way trade flow data are downloaded from UN COMTRADE, stored, validated and presented in a way that has more value added for the end-user. The system allows for semi-automatic updating of the data.
Trade flow data discrepancies and the need for data validation
Import and export data which specifies country of origin and country of destination are called dyadic data or bilateral tradeflow data. Such data provide useful insights into the state and development of globalised forest products and related markets and they are an input into macro-econometric models.
However, data quality varies greatly throughout the product range and across countries: tradeflow figures might be erroneous or missing. When looking at annual trade of a commodity between countries, large discrepancies can appear, for various reasons.
Each time when a country A exports a certain commodity to country B, a number of data variables are recorded, typically by each of the respective national customs organisations as export and import. The recorded data include value of the shipment and quantity in one or more unit types, typically in metric tonnes and cubic meters but depending on the commodity, a wealth of different quantity metrics can be applied in different countries.
Normally the quantity of a shipment should remain the same between origin and destination country and the value should also remain more or less the same. However, as in many cases these data are not comparable, it is difficult to judge which of the data would be correct.
Some of the reasons for trade flow data discrepancies are reported here below (not in order of importance):
- Triangular trade
- Product conversion in customs zones or free-trade areas
- Mis-reportings by one of the partner countries
- Non-reportings by one of the partner countries (the ‘mirror issue’)
- Differences between countries in methods of assessing trade value and quantity (particularly an issue with intra-EU trade)
- Partners report in different classification systems
- Time-shift effects due to trade leaving a country in one period and arriving in partner country in the next period
- Erroneous indication or misinterpretation of units or currencies
- Erroneous conversion between quantity units or between currencies
- Confidentiality e.g. when there are very few economic operators related to a particular commodity in a country
Building further on the method developed by Michie and Wardle (2002), a data quality assessment and correction procedure was developed to handle outliers (i.e. data that are out of bounds and surely erroneous), mirroring missing data, estimating missing quantity data (cubic meters or metric tonnes, depending on the commodity international standard quantity unit).
Data source and classification
Historically the organisation collecting data on the international trade in goods is the Customs Cooperation Council (CCC), established in 1952 and which was renamed in 1994 to World Customs Organisation (WCO). Traded products were classified according to the Standard International Trade Classification (SITC) until the CCC adopted a new trade classification called the Harmonized System (HS). The International Convention on the Harmonized Commodity Description and Coding System was adopted in 1983 and the first version of the Harmonized System entered into use as of 1988. The Harmonized System is a hierarchical classification in which commodities are encoded with unique 6-digit codes, explained with corresponding definitions. The classification system is issued with revisions about every 5 years. As such, consecutive revisions entered into force in 1988, 1992, 1996, 2002, 2007, 2012, 2017 and the latest version that came into force in 2022. Each of these revisions included additions or deletions of codes, in response to changing significance either in terms of commodity values or quantities or in terms of policy or societal values or both. The HS2022 now enables a better distinguishment of commodities of tropical wood from other wood species, and commodities such as glue-laminated timber cross-laminated timber, I beams will get their own specific codes.
Product scope
Currently in total 7 HS chapters relate to forest fibre commodities. Yearly COMTRADE data for the wood-based forest commodities were compiled from the following chapters:
- Chapter 44: Wood and articles of wood; wood charcoal
- Chapter 45: Cork and articles of cork
- Chapter 46: Manufactures of straw, of esparto or of other plaiting materials; basketware and wickerwork (including products made of bamboo and rattan)
- Chapter 47: Pulp of wood or of other fibrous cellulosic material; Recovered paper and paperboard
- Chapter 48: Paper and paperboard; Articles of paper pulp, of paper or of paperboard
- Chapter 49: Printed books, newspapers, pictures and other products of the printing industry; Manuscripts, typescripts and plans
- Chapter 94: Furniture; Bedding, mattresses, mattress supports, cushions and similar stuffed furnishings; Lamps and lighting fittings, not elsewhere specified or included; Illuminated signs, illuminated name-plates and the like; prefabricated buildings.
Time coverage
The database offers yearly data, starting from the year 1988. Note that in the beginning years, not all countries yet reported their data to WCO according the HS system, but according the SITC system and hence the data in those beginning years is not always market-representative (see notes on classification systems in the preceding section ‘data source and classification’). The database is regularly updated. At the time of a major revision of the user interface, the latest available year is 2021. Note that there is usually a two-year time-gap until yearly UN COMTRADE data reach complete data coverage.
Data handling and cleaning method
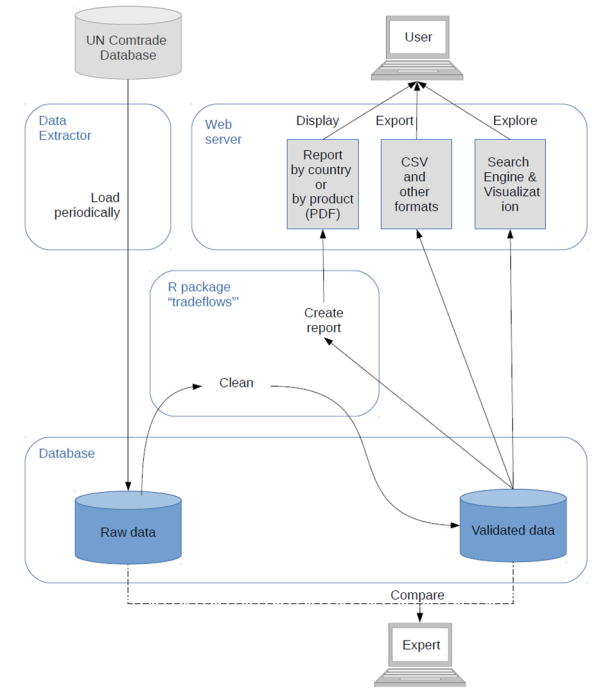
The trade flow database interacts with three modules illustrated the following figure: data extractor, data cleaning and query interface. The data extractor is capable of automatically querying products trade flows from the ComTrade data interface (ComTrade API), parsing them and inserting them into the database. The data cleaning module is implemented in the R statistical language. Tradeflows are cleaned by using an automated and reproducible procedure. The query interface - accessible through a web server - allows users to visualise tradeflows and generate PDF-reports.
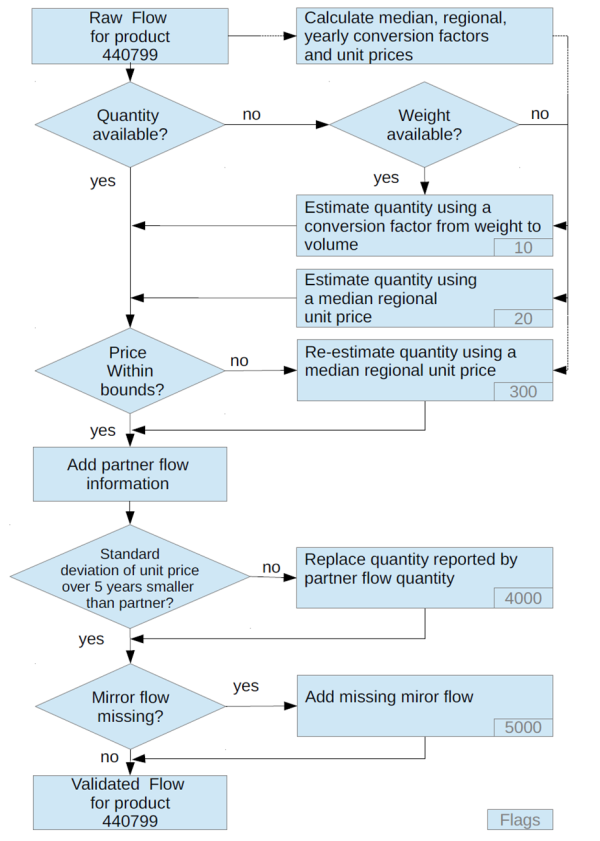
The following figure illustrates how various data manipulation steps are connected to handle missing quantity data, out of bounds prices and mirror information from the trade partner. Each step in the workflow is explained in more detail in the project report as indicated in the section below.
Explore data, graphs and reports
The forest products trade flow database can be queried through a web interface, which has four sub-components: Single country search, Country group search, Trade reports (PDF), and Legacy query.
Single country search and Country group search - The first two components allow searching and visually exploring data through a simple user interface – either for single countries, or for country groups. Images can be downloaded by the user as static PNG-files, which do not include the meta-data or image-zooming capability. These components are for data exploration. If you want to download data, then use the Legacy query (see below).
Trade reports (PDF) - The third component allows on-demand production of pre-formatted but customizable PDF reports. Depending on the complexity of the user query, reports may take half a minute or more to complete, but it is not necessary to resubmit the query – with some patience, the report is produced.
- Completeness report for one product and all countries; based on raw data: shows the UN COMTRADE data availability.
- Discrepancy report for one reporter and product with all partners; based on raw data: shows the discrepancy between trade partner reporting of trade value and quantity.
- 2 types of overview report; based on cleaned data.
- Value data for major trade flows for one reporting country and all products
- Quantity data for major trade flows for one reporting country and all products
- Roundwood equivalent report. This report estimates the equivalent of roundwood that was required to produce a country’s wood-based trade output. This is a research output and needs to be interpreted with caution. Make sure to carefully read the interpretation guidance!
Legacy query - The fourth component provides a more standard data interface, allowing querying trade flow data between a reporting country and a multitude of trade partner countries, in volume or quantity, for a selected period of time. This component allows downloading the data in an excel file, for further processing by the user.
Free and open source software were used during the development of this website.
Download the methodological report
The methodological report was published in the EFI Technical Report series: Rougieux et al. 2017. The Forest Products Trade Flow Database – A reproducible method and tool to support the analysis of international forest products trade. EFI Technical Report 100, 2017.
Please note that the report explains the data cleaning methodology, but that the sections on the visualization are not any longer fully up-to-date and do not represent the latest changes.
Acknowledgement
The database methodology was developed and implemented in 2015 by Paul Rougieux (R-script for data cleaning, PDF reports), Jo Van Brusselen (project lead), Simo Varis (Comtrade data downloads and updates, user interface and server management), Sergey Zudin (user interface).
The 2023 update of the graphical user interface was developed by Janne Järvikylä (concept, design, implementation), Johanna Klapper (roundwood equivalent report R-script), Simo Varis (data updates, server management) and Jo Van Brusselen (concept, design, reports, review) at European Forest Institute, as part of the BioScope project activities, in 2022. The BioScope project was financed by the European Union and the European Regional Development Fund (ERDF) through the North Karelia Regional Council. The BioScope project was implemented by the University of Eastern Finland, Natural Resources Institute Finland and the European Forest Institute.
The initial development of this database was possible thanks to financial support from the FLEGT Independent Market Monitoring – a multi-year project supervised by ITTO and financed by the European Union (EU) to monitor impacts on trade from the EU FLEGT Action plan, including the EU Timber Regulation and bilateral Voluntary Partnership Agreements (VPA) between the EU and timber supplying countries.
We would like to thank Steve Johnson, Rupert Oliver and Jean-Christophe Claudon at ITTO, for their very constructive support and advice based on their longstanding expertise with the analysis of trade flow data. We would also like to thank Ronald Jansen, Markie Muryawan, Daniel Eshetie and Nancy Snyder at UN COMTRADE for granting us unrestricted access and for help with setting up the connection to the database. We wish to congratulate UN COMTRADE with the important step to increasing timely, speedily and free access of their data through the COMTRADE API.
Special thanks go also to Ed Pepke and Tomi Tuomasjukka who with their colleagues at the EU FLEGT Facility Analysis Team were also at the crib of the concept to redevelop towards a more automated and open system for updating and validating the EFI-WFSE forest products trade flow database. Latter database was originally developed at EFI by Bruce Michie and Philip Wardle, who we warmly want to acknowledge for their ground-breaking work.
All mistakes remain ours.
Explore data, graphs and reports